Using Charts to Show the Same Information
On our home page, we saw a table that answered the following important questions. We now consider the same questions but answer them by using charts.
What are my team’s chances this season? And how important is their next game?
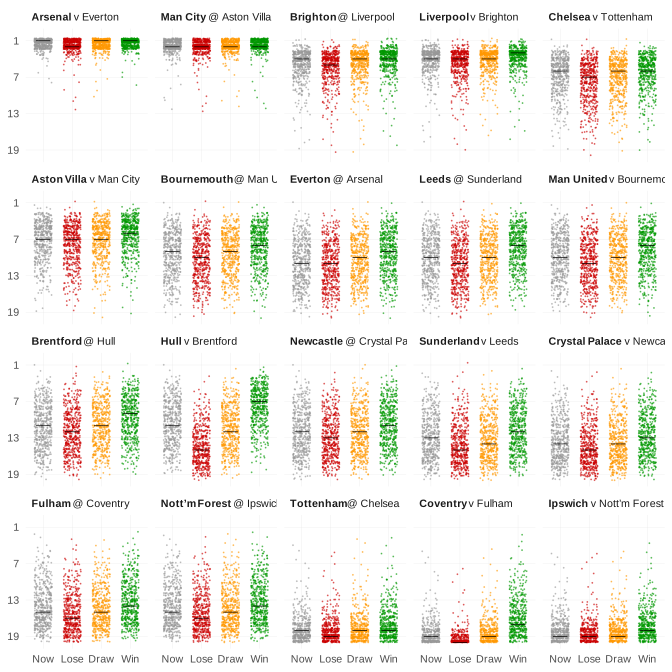
Each dot of this chart shows the outcome of a different scenario for where a team finishes in the league this season. The higher the dot, the better the finish.
With each team, there are four series:
- The scenarios associated with the team’s prospects NOW (in grey)
- What those prospects will become if the team’s players LOSE their next game (in red)
- What those prospects will become if the team’s players DRAW their next game (in amber)
- What those prospects will become if the team’s players WIN their next game (in green)
We order the teams according to their current expected position at the end of the season, denoted by the dark horizontal line (median) for the team’s series in grey.
We also note that:
You can hover over any scenario (i.e. dot) on the chart for further details about it
Whilst there are many dots on this plot, we actually generate far more scenarios than this in reality. We’ve merely summarised them on the chart for the sake of aesthetics
We have also created this non-interactive version of the chart
You might want to peruse our approach and its associated caveats, such as: the fact that values like 0% or 100% aren’t always quite what they seem; or our license about how to use (or not use) these values.